
Bristol Travel to Work Survey Results
The Bristol data includes all responses from people who work at participating organisation’s sites that are located in the Bristol City Council area.
- This will include people who both live and work in Bristol and those who commute into the area.
- In 2025, there were 7,132 responses for the Bristol UA area. In 2024, there were 6,092 responses.
- This year, 63 organisations based in Bristol UA took part in the survey – 41 of these also took part in 2024, 13 were new to the survey and 9 came back after taking a break.
Headlines
1. The % of people spending the majority of their time at their workplace continues to increase. 70% of respondents say they are spending the majority of their working hours at a workplace while 28% are spending the majority of their working hours at home. In 2024 the figures were 65% and 32% respectively and in 2023 they were 64% and 33%

2. Hybrid working is still popular. The mean is 3.1 days/week at a workplace and 1.5 days at home.

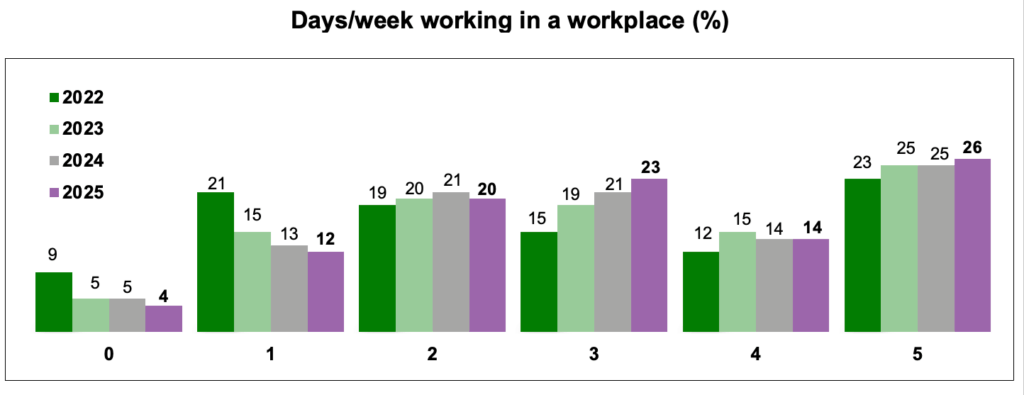
2.1 96% of people go into work at least 1 day a week, this is up from 95% in 2024. 64% go into work 3 or more days a week, this is up from 61% in 2024.
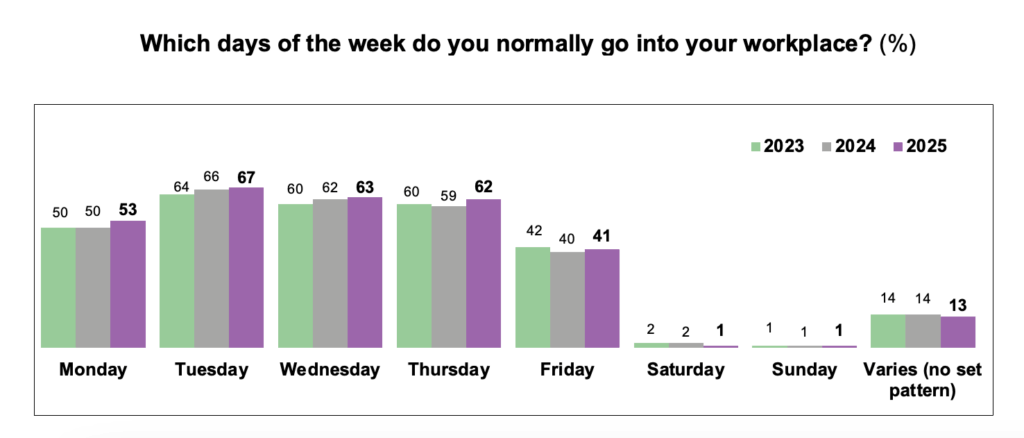
2.2 Midweek is when the majority of people are going into the office. Tuesday is still the busiest day with 67% (up from 66% in 2024) and Friday is still the quietest with 41% (up from 40% in 2024 but down from 42% in 2023).
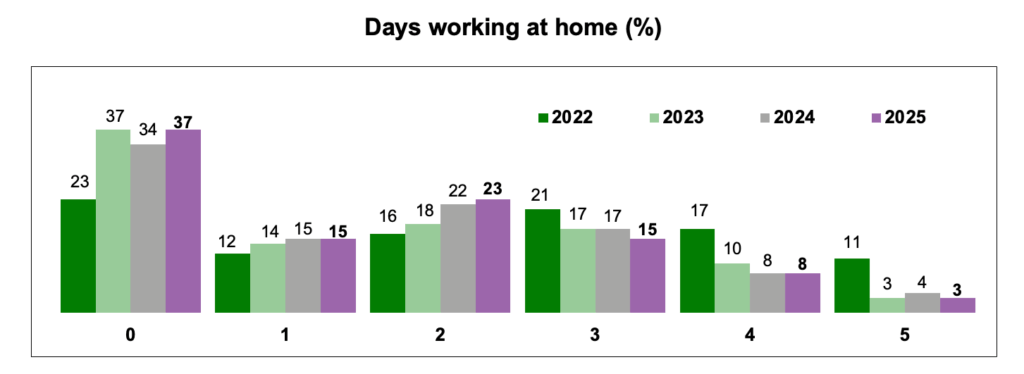
2.3 63% of people continue to work at home at least 1 day a week, this is down from 66% in 2024. 26% are working from home 3 or more days a week, this is down from 29% in 2024.
3. 36% of respondents are commuting by personal motor vehicle. 29% are driving alone by car (down from 31% in 2024), 6% are car sharing (up from 5% in 2024) and 1% are travelling by motorbike/moped (same as 2024).
4. 32% of respondents are commuting by active travel. This figure is higher than 2024 (30%). 17% are walking and 15% are cycling into work (the figures for 2024 were 16% and 14% respectively).
5. 25% of respondents are commuting by public transport. This is the same as 2024. 16% are taking the bus and 9% are taking the train (the figures for 2024 were also 16% and 9% respectively).
6. 3% of respondents are working all the time from home. This is down from 4% in 2024 and 2023. It is still much higher than pre-Covid surveys where 0% were working only from home.
7. 3% of respondents commute by e-travel. This figure has remained consistent since 2022.

8. Those commuting by train are travelling into work the least – on average, 2.2 days per week (down from 2.3 days in 2024). Those car-sharing into work go in the most often – on average 3.6 days per week followed closely by walking (3.5 days), then car driver (alone) & cycle (both 3.4 days) and then bus (2.9 days).
9. One-way journey times and journey distances to work have reduced slightly in 2025. One-way journey time in Minutes (Mean) is 39 minutes compared to 40 minutes in 2024. One-way journey distance in Miles (Mean) is 11 miles compared to 12 miles in 2024.
10. People who walk, cycle or scoot to work have higher journey satisfaction than those who use public transport or road-based transport (car, motorbike). People are slightly more satisfied with their journey to work (58%) than from work (54%), this is the same across most individual travel modes. Satisfaction rates for working from home have decreased slightly from 94% in 2024 to 93% in 2025.
If your organisation would like to find out more about the Annual Travel to Work Survey in Bristol please email: [email protected]


